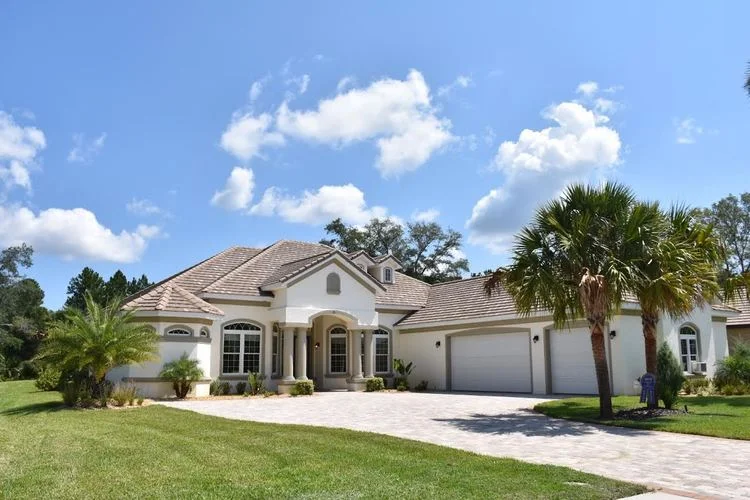
NAR: Existing Home Sales Rise 2.5% in May


While up from April, sales slipped 1% from a year ago, NAR's chief economist says buyers are responding to lower mortgage rates and their greater purchasing power. 

WASHINGTON – Existing-home sales rebounded in May, recording an increase in sales for the first time in two months, according to the National Association of Realtors® (NAR). Each of the four major U.S. regions saw a growth in sales, with the Northeast experiencing the biggest surge last month.

Total existing-home sales – completed transactions that include single-family homes, townhomes, condominiums and co-ops – jumped 2.5% from April to a seasonally adjusted annual rate of 5.34 million in May. Total sales, however, are down 1.1% from a year ago (5.40 million in May 2018).

Lawrence Yun, NAR’s chief economist, said the 2.5% jump shows that consumers are eager to take advantage of the favorable conditions. “The purchasing power to buy a home has been bolstered by falling mortgage rates, and buyers are responding.”

The median existing-home price for all housing types in May was $277,700, up 4.8% from May 2018 ($265,100). May’s price increase marks the 87th straight month of year-over-year gains.

Total housing inventory at the end of May increased to 1.92 million, up from 1.83 million existing homes available for sale in April and a 2.7% increase from 1.87 million a year ago. Unsold inventory is at a 4.3-month supply at the current sales pace, up from both the 4.2-month supply in April and from 4.2 months in May 2018.

Though inventory is up, the months’ supply numbers remain near historic lows, which has a direct effect on price, according to Yun. “Solid demand along with inadequate inventory of affordable homes have pushed the median home price to a new record high,” he said.

Properties remained on the market for an average of 26 days in May, up from 24 days in April and equal to the 26 days in May of 2018. Fifty-three percent of homes sold in May were on the market for less than a month.

Given that housing and properties have been selling so quickly, Yun continues his call for new construction. “More new homes need to be built,” he said. “Otherwise, we risk worsening the housing shortage, and an increasingly number of middle-class families will be unable to achieve homeownership.”

Realtor.com’s Market Hotness Index, measuring time-on-the-market data and listing views per property, revealed that the hottest metro areas in May were Rochester, N.Y.; Fort Wayne, Ind.; Lafayette-West Lafayette, Ind.; Boston-Cambridge-Newton, Mass.; and Midland, Texas.

According to Freddie Mac, the average commitment rate for a 30-year, conventional, fixed-rate mortgage decreased to 4.07% in May, down from 4.14% in April. The average commitment rate across all of 2018 was 4.54%.

“The month of May ushered in the home sales upswing that we had been expecting,” said NAR President John Smaby. “Sales are strengthening in all regions while we see price appreciation for recent buyers.”

First-time buyers were responsible for 32% of sales in May, unchanged from the 32% the month prior and up from the 31% recorded in May 2018.

All-cash sales accounted for 19% of transactions in May, down from April and a year ago (20% and 21%, respectively). Individual investors, who account for many cash sales, purchased 13% of homes in May, down from 16% in April and from 14% a year ago.

Distressed sales – foreclosures and short sales – represented 2% of sales in May, down from 3% in April and from 3% in May 2018. Less than 1% of May 2019 sales were short sales.

Single-family and condo/co-op sales

Single-family home sales sat at a seasonally adjusted annual rate of 4.75 million in May, up from 4.63 million in April and down 0.8% from 4.79 million a year ago. The median existing single-family home price was $280,200 in April, up 4.6% from May 2018.

Existing condominium and co-op sales were recorded at a seasonally adjusted annual rate of 590,000 units in May, up 1.7% from the prior month and down 3.3% from a year ago. The median existing condo price was $257,100 in May, which is up 5.4% from a year ago.

Regional breakdown

May existing-home sale numbers in the Northeast increased 4.7% to an annual rate of 670,000, about equal to a year ago. The median price in the Northeast was $304,100, up 6.6% from May 2018.

In the Midwest, existing-home sales jumped 3.4% to an annual rate of 1.22 million, which is 3.9% below May 2018 levels. The median price in the Midwest was $220,500, an increase of 5.6% from a year ago.

Existing-home sales in the South grew 1.8% to an annual rate of 2.32 million in May, up 1.3% from a year ago. The median price in the South was $241,400, up 3.6% from a year ago.

Existing-home sales in the West grew 1.8% to an annual rate of 1.13 million in May, 3.4% below a year ago. The median price in the West was $409,100, up 4.1% from May 2018.

© 2019 Florida Realtors®

Florida Housing Market Report: Sales & Median Prices Up in May

By Florida Realtors

May was “the highest single-family home sales’ monthly total for any single month in … 10 years," says Brad O'Connor, Florida Realtors chief economist.

ORLANDO, Fla – Florida’s housing market reported increased sales, higher median prices, more pending sales and gains in inventory (active listings) in May compared to a year ago, according to the latest housing data released by Florida Realtors®. Sales of single-family homes statewide totaled 30,742 last month, up 9.6% over May 2018.

FLORIDA HOUSING MARKET UPDATE: MAY 2019

May turned out to be one of the strongest months we’ve seen in a long time for single-family homes in the Sunshine State. We're talking a 9.6 percent increase in sales from May 2018 and our highest monthly total for *any* single month over at least the past 10 years.
“Low interest rates continue to fuel buyer demand in Florida’s housing market,” said 2019 Florida Realtors President Eric Sain, a Realtor and district sales manager with Illustrated Properties in Palm Beach. “In May, new pending sales for existing single-family homes were up 5% year-over-year, while pending sales for existing condo-townhouse properties rose slightly (0.5%). Inventory levels have steadily improved, which offers more choices for homebuyers. Statewide, single-family inventory (active listings) last month rose 4% over May 2018, while condo-townhouse inventory increased 4.8%.

“For expert advice and peace of mind, buyers and sellers should consult a local Realtor to learn more about area market conditions.”

In May, statewide median sales prices for both single-family homes and condo-townhouse properties rose year-over-year for the 89th consecutive month. The statewide median sales price for single-family existing homes was $266,000, up 4.3% from the previous year, according to data from Florida Realtors Research Department in partnership with local Realtor boards/associations. Last month’s statewide median price for condo-townhouse units was $195,000, up 3.7% over the year-ago figure. The median is the midpoint; half the homes sold for more, half for less.

According to the National Association of Realtors® (NAR), the national median sales price for existing single-family homes in April 2019 was $269,300, up 3.7% from the previous year; the national median existing condo price was $251,000. In California, the statewide median sales price for single-family existing homes in April was $602,920; in Massachusetts, it was $394,000; in Maryland, it was $295,000; and in New York, it was $271,000.

Looking at Florida’s condo-townhouse market in May, statewide closed sales totaled 12,217, up 1.6% compared to a year ago. Closed sales may occur from 30- to 90-plus days after sales contracts are written.

“May turned out to be our highest single-family home sales’ monthly total for any single month over at least the past 10 years,” said Florida Realtors Chief Economist Dr. Brad O’Connor. “What’s more, this growth was widespread, with sales increasing in 21 of the state’s 22 metropolitan areas.

“This resurgence in single-family home sales is largely being driven by a single factor, which is that mortgage interest rates have been declining sharply since late last year. It’s worth noting, for instance, that all-cash single-family home sales were actually only up 1.5% in May, whereas transactions involving financing were up over 12%.”

According to Freddie Mac, the interest rate for a 30-year fixed-rate mortgage averaged 4.07% in May 2019, down from the 4.59% averaged during the same month a year earlier.

© 2019 Florida Realtors

Survey: More Homeowners Think It’s a Good Time to Sell

By Florida Realtors

If current owners were waiting for rising prices to moderate, it’s time to move. NAR’s latest survey finds 46% believe it’s a good time to sell.

WASHINGTON – The latest consumer findings from a National Association of Realtors® (NAR) survey reveal that many more Americans believe that now is a good time to sell a home.

The second quarter of 2019 saw a jump in optimism in selling – 46% strongly held that belief, up from 37% in the first quarter.

NAR’s chief economist Lawrence Yun says that home prices have increased only moderately and are a contributing factor for the reason a majority feel that now is a good time to sell. “With home price appreciation slowing, home sellers understand that the days of large price gains from holding an extra year are over,” he says.

An increased number of Americans also think it’s a good time to buy a home, and of those respondents, 38% strongly believe that notion, and 27% said they moderately believe it. Thirty-five percent disagreed, however, saying it’s not a good time to make a home purchase, which is unchanged from 2019’s first quarter.

NAR’s second quarter Housing Opportunities and Market Experience (HOME) survey also looked at consumer attitudes regarding the nation’s economy, and 55% said that the economy is improving; up from 53% in the previous quarter. Second quarter optimism was greatest among those who earn $100,000 or more and those who reside in rural areas. Fifty-three percent of Gen Xers said they believe the economy is improving, which is also up from 50% last quarter.

Yun said Gen Xers might have more financial pressures compared to other age groups.

“Many in the Generation X population find themselves needing to purchase multi-generational homes,” he says. “Also, they may be feeling financial stress from caring for aging parents and children of all ages. Nonetheless, they have an optimistic outlook about the future.”

To that point, 63% of Gen Xers believe home prices have increased within their communities in the last 12 months, a slight jump from the first quarter’s 61%.

Respondents were also asked to share their thoughts on future home prices in their neighborhoods, and 43% percent believe prices will remain the same in their communities over the next six months, a figure which is consistent with the previous quarter; 49% expect to see a price increase.

Among those surveyed who do not currently own a home, 27% said they believe it would be very difficult to qualify for a mortgage due to their financial state; 30% said it would be somewhat difficult.

Yun said that mortgage affordability was promising over the second quarter, and he predicts this trend will continue. “Lower mortgage rates, along with job and wage growth, will lead to an increase in sales and thereby contribute positively to economic growth in the upcoming quarters.”

© 2019 Florida Realtors®

Lenders must accept private flood insurance policies after July 1

WASHINGTON – June 18, 2019 – The threat to home closings during a National Flood Insurance Program (NFIP) shutdown may be muted or nonexistent should Congress fail to extend the program in the future. After July 1, a federal law forces mortgage lenders to accept private coverage if it satisfies criteria outlined in the Biggert-Waters Flood Insurance Reform Act of 2012.

In February, five federal regulatory agencies – the FDIC, Office of the Comptroller of the Currency, Board of Governors of the Federal Reserve System, National Credit Union Administration and Farm Credit Administration – issued a joint final rule to implement provisions of the Act, which outlines the new private flood insurance mandate and the steps insurance companies and mortgage lenders must follow.

The rule, which takes effect July 1, 2019:

  • Implements the Biggert-Waters Act requirement that regulated lending institutions accept private flood insurance policies that satisfy criteria specified in the Act
  • Allows institutions to rely on an insurer's written assurances in a private flood insurance policy stating the criteria are met
  • Clarifies that institutions may, under certain conditions, accept private flood insurance policies that do not meet the Biggert-Waters Act criteria
  • Allows institutions to accept certain flood coverage plans provided by mutual aid societies, subject to agency approval

Private flood insurance could be offered as a stand-alone policy or as an endorsement attached to a full property insurance policy. Lenders won't have to verify that a flood policy or endorsement is acceptable, providing it includes the following endorsement: "This policy meets the definition of private flood insurance contained in 42 U.S.C. 4012a(b)(7) and the corresponding regulation."

However, the law also allows a lender to do its own due diligence if it prefers not to rely on the statement.

A full copy of the 90-page order is posted on the U.S. Department of the Treasury's Office of the Comptroller of the Currency website.

© 2019 Florida Realtors®

Some Florida Coties Top U.S. Growth Charts - Fort Myers No. 1

Some Fla. cities top U.S. growth charts – Fort Myers No. 1

ORLANDO, Fla. – Oct. 3, 2018 – In a WalletHub study of growth in U.S. cities, Fort Myers ranked at the top both overall and in the small-city category – but the state overall showed strong growth. In the ranking of large metro areas, Miami ranked second after Austin, Texas. In the ranking of midsize cities, Lehigh Acres ranked sixth.

To determine growth over a seven-year period, WalletHub used 15 metrics to compare 515 U.S. cities. The study included only the area within city limits, and they ranged from a score of 76.57 (Fort Myers) down to 17.27 (Shreveport, La.) The lowest Florida score was Lauderhill's 36.27.

Florida's large cities by rank out of a total of 66, ranking 65.83 to 28.27

2. Miami: 65.75

19. Tampa: 53.42

26. Jacksonville: 50.61

Florida's medium cities by rank out of a total of 233, ranking 73.55 to 29.80

5. Lehigh Acres: 71.00

12. Cape Coral: 64.38

21. Orlando: 59.66

30. Davie: 57.63

40. Pompano Beach: 55.82

42. Port St. Lucie: 55.549

45. Coral Springs: 54.87

50. Brandon: 54.59

52. Miramar: 54.17

64. West Palm Beach: 52.44

67. Pembroke Pines: 52.18

71. St. Petersburg: 51.81

73. Palm Bay: 51.73

78. Lakeland: 50.76

80. Clearwater: 50.60

97. Hollywood: 48.64

100. Fort Lauderdale: 48.44

113. Hialeah: 47.55

121. Miami Gardens: 46.63

147. Spring Hill: 44.64

180. Tallahassee: 40.09

185. Gainesville: 39.22

Florida's small cities by rank out of a total of 200, ranking 76.57 to 17.27

1. Fort Myers: 76.57

15. Boynton Beach: 60.51

16. Sunrise: 60.04

18. Town 'n' Country: 58.31

22. Boca Raton: 56.69

26. Palm Coast: 55.50

38. Largo: 52.67

42. Deltona: 51.47

48. Weston: 50.36

53. Plantation: 49.56

59. Deerfield Beach: 48.30

85. Melbourne: 44.72

98. Miami Beach: 43.52

134. Kendall: 38.47

152. Lauderhill: 36.27

© 2018 Florida Realtors®

Realtor.com: Inventory Crisis Appears to be Ending

Realtor.com: Inventory crisis appears to be ending

SANTA CLARA, Calif. – Oct. 3, 2018 – Realtor.com's September housing report shows national inventory has started to flatten, signaling a crucial inflection point for the inventory crisis. The numbers are based on listings submitted to realtor.com for the month, and it refers to realtor.com listing prices rather than actual selling prices.

According to the realtor.com report, inventory declined a small 0.2 percent from a year ago, but it's poised for positive growth ahead thanks to an 8 percent increase in new listings – the largest yearly jump since 2013.

"After years of record-breaking inventory declines, September's almost flat inventory signals a big change in the real estate market," says Danielle Hale, chief economist for realtor.com. "Would-be buyers who had been waiting for a bigger selection of homes for sale may finally see more listings materialize.

"But don't expect the level to jump dramatically," Hale warns. "Plenty of buyers in the market are scooping up homes as soon as they're listed, which will keep national increases relatively small for the time being."

Florida cities cited in realtor.com's September study

  • Jacksonville: Current inventory up 14%; new inventory up 54%
  • Tampa-St. Petersburg-Clearwater: Current inventory up 7%; new inventory up 65%
  • Miami-Fort Lauderdale-West Palm Beach: Current inventory up 3%; new inventory up 79%
  • Orlando-Kissimmee-Sanford: Current inventory down 1%; new inventory up 50%

In September, the U.S. median listing price remained at $295,000, a 7 percent increase year-over-year, but lower than last year's 10 percent increase, according to realtor.com. Homes continued to sell at a relatively rapid pace of 65 days on average – 4 days faster than last year.

More than 465,000 new listings entered the market in September. The new listings were 8 percent ($25,000) cheaper than existing inventory in the market, and 10 percent (200 square-feet) smaller than homes already in the market, on average.

Although single-family home inventory remained relatively flat, declining by only 1 percent, new inventory growth was found in condominiums and townhomes, which are now up 3 percent year-over-year.

The inventory recovery is particularly visible in larger cities. In September, 22 of the 45 largest markets in the U.S. saw year-over-year inventory increases. The five markets that saw the largest inventory jumps were San Jose, Calif.; Seattle; Jacksonville, Fla.; San Diego, and San Francisco, all posting increases of 31 percent or more.

Inventory also rose over last year in Chicago, Miami, Dallas, Boston, Los Angeles, and New York.

Combined inventory in the 45 largest markets increased 5.6 percent year-over-year on average.

© 2018 Florida Realtors®

NAR Survey: Homeowners Ready to Sell in 3Q 2018

NAR survey: Homeowners ready to sell in 3Q 2018

WASHINGTON – Sept. 27, 2018 – New findings from the National Association of Realtors® (NAR) show that a record high 77 percent of Americans believe that now is a good time to sell a house, while those that think now is a good time to buy continues to decline.

NAR's third quarter Housing Opportunities and Market Experience (HOME) survey also found that a majority of consumers believe prices have and will continue to rise, while the quality of schools is a critical factor in deciding whether or not to buy a home.

Half of all Americans strongly believe now is a good time to sell (compared to 46 percent last quarter), while 27 percent moderately believe this is the right time (29 percent last quarter). Respondents in the West are the most likely to think now is a good time (85 percent) as are those who currently own a home (82 percent). Only 22 percent believe that now is not a good time to sell, down from 29 percent in the second quarter.

Optimism that now is a good time to buy has declined slightly from last quarter. Sixty-three percent of respondents either strongly or moderately believe that now is a good time buy compared to 68 percent last quarter. Among renters, positive feelings about purchasing continue to fall, dropping from 49 percent in the second quarter to 45 percent this quarter. Optimism is highest among older U.S. households (65 or over) and those with a household income of more than $100,000 a year (70 and 68 percent respectively).

NAR Chief Economist Lawrence Yun says several consecutive years of strong home price growth are enticing homeowners to consider selling.

"Though the vast majority of consumers believe home prices will continue to increase or hold steady, they understand the days of easy, fast gains could be coming to an end," Yun says. "Therefore, more are indicating that it is a good time to sell, which is a healthy shift in the market."

Respondents were also asked about their view of home prices in their neighborhoods. Seventy percent believe that home prices have gone up in their area in the last 12 months, up from 68 percent in the second quarter. Fifty-three percent also believe that home prices will continue to increase in their communities in the next six months; this is down from the last quarter (55 percent).

Consumers: Positive about economy, concerned about qualifying for a mortgage

A near-record high of 60 percent of households believe that the economy is improving – up slightly from 58 percent last quarter and up significantly from 53 percent in the third quarter of 2017. People in a household income of over $100,000 are more likely to view the economy as improving (67 percent) compared with those with an income $50,000 to $100,000 (64 percent) and under $50,000 (49 percent).

The HOME survey's monthly Personal Financial Outlook Index, showing respondents' confidence that their personal financial situation will be better in six months, rose slightly from 62.1 in June to 62.6 in September. A year ago, the index was 62.0.

Among those who do not currently own a home, 28 percent of those surveyed believe that it would be very difficult to qualify for a mortgage and 31 percent believe that it would be somewhat difficult given their current financial situation (compared to 26 and 28 percent last month respectively). "This is most likely a manifestation of the constantly rising prices," said Yun. "As prices rise so do down payments, making the mortgage qualifying process more challenging."

Homebuying decision: Importance of highly rated schools, other factors

In this quarter's survey, homeowners and non-homeowners were asked how important high rated schools are in their home buying decision. Over two-thirds of those surveyed said that highly rated schools were either very or somewhat important in their decision (47 percent and 23 percent, respectively).

When asked about what considerations were taken into account when choosing a new neighborhood, 25 percent of respondents ranked proximity to friends and family as most important, followed by proximity to their job and a short commute (24 percent). Proximity to friends and family is most important to those in rural areas (31 percent) compared to suburban and urban (25 and 21 percent respectively).

"When you buy a home, you do not just buy the house; you buy a community – neighbors, parks, stores and schools," said NAR President Elizabeth Mendenhall. "Realtors understand the unique qualities of the neighborhoods in their area and can help individual families find and purchase the right home in the right neighborhood."

Respondents were also asked about the number of homes available for sale in their communities. Fifty-six percent of respondents reported that the number of homes available for sale in the neighborhood has remained the same over the past six months, while 23 percent said they have observed more homes for sale than usual.

About NAR's HOME survey

From July through September, a sample of U.S. households was surveyed via random-digit dial, including a mix of cell phones and land lines. The survey was conducted by an established survey research firm, TechnoMetrica Market Intelligence. Each month about 900 qualified households responded to the survey. The data was compiled for this report representing a total of 2,731 household responses.

© 2018 Florida Realtors®

NAR: Pending Home Sales Dip 1.8% in August

NAR: Pending home sales dip 1.8% in August

WASHINGTON – Sept. 27, 2018 – Pending home sales fell slightly in August and have now decreased on an annual basis for eight straight months, according to the National Association of Realtors®.

The Pending Home Sales Index, a forward-looking indicator based on contract signings, decreased 1.8 percent to 104.2 in August from 106.1 in July. With last month's decline, contract signings are now down 2.3 percent year-over-year.

Lawrence Yun, NAR chief economist, says that low inventory continues to contribute to the housing market slowdown. "Pending home sales continued a slow drip downward, with the fourth month over month decline in the past five months," he said.

"Contract signings also fell backward again last month, as declines in the West negatively impacted overall activity," he said. "The greatest decline occurred in the West region where prices have shot up significantly, which clearly indicates that affordability is hindering buyers and those affordability issues come from lack of inventory, particularly in moderate price points."

According to the third quarter Housing Opportunities and Market Experience (HOME) survey, a record high number of Americans believe now is a good time to sell. "Just a couple of years ago about 55 percent of consumers indicated it was a good time to sell; that figure has climbed close to 77 percent today."

Added Yun, "With prices having risen so quickly, many consumers were deciding to wait to list their homes hoping to see additional price and equity gains. However, with indications that buyers are beginning to pull out, price gains are going to decelerate and potential sellers are considering that now is a good time to list and bring more properties to the market."

Yun pointed to year-over-year increases in active listings from data at realtor.com® to illustrate a potential rise in inventory. Columbus, Ohio, Seattle-Tacoma-Bellevue, Wash., San Diego-Carlsbad, Calif., Providence-Warwick, RI-Mass. and Nashville, Tenn. saw the largest increase in active listings in August compared to a year ago.

When it comes to rising mortgage rates, Yun believes that while rising rates are always a deterrent to potential buyers, it should not lead to a significant decline. "We have two opposing factors affecting the market: the negative impact of rising mortgage rates and the positive impact of continued job creation. This should lead to future homes sales staying fairly neutral," said Yun. "As long as there is job growth, rising mortgage rates will hinder some buyers; but job creation means second or third incomes being added to households which gives consumers the financial confidence to go out and make a home purchase."

Yun expects existing-home sales this year to decrease 1.6 percent to 5.46 million, and the national median existing-home price to increase 4.8 percent. Looking ahead to next year, existing sales are forecast to rise 2 percent and home prices around 3.5 percent.

August pending home sales regional breakdown

The PHSI in the Northeast dropped 1.3 percent to 92.7 in August, and is now 1.6 percent below a year ago. In the Midwest, the index slid back 0.5 percent to 101.6 in August and is also 1.1 percent lower than August 2017.

Pending home sales in the South dipped 0.7 percent to an index of 121.3 in August, however, that number is 1.3 percent higher than a year ago. The index in the West decreased 5.9 percent in August to 89.1 and plummeted 11.3 percent below a year ago.

© 2018 Florida Realtors®

CoreLogic: Strong Economy Boosts Homeowner Equity in 2Q 2018

CoreLogic: Strong economy boosts homeowner equity in 2Q 2018

IRVINE, Calif. – Sept. 24, 2018 – CoreLogic released its National Homeowner Equity Insights Report for Q2 2018: it notes that much of the country is seeing "homeowners emerge from the negative equity trap."

U.S. homeowners with mortgages (which account for roughly 63 percent of all properties) have seen their equity increase by 12.3 percent year-over-year, representing a gain of nearly $981 billion since the second quarter of 2017, according to CoreLogic. About 221,000 residential properties regained equity compared with the first quarter of 2018.

Equity improves nationwide

Additionally, the average homeowner gained $16,200 in home equity between the second quarter of 2017 and the second quarter of 2018. While home equity grew in almost every state in the nation, western states experienced the most significant increases. California homeowners gained an average of approximately $48,800 in home equity, and Washington homeowners experienced an average increase of approximately $41,100 in home equity

From the first quarter to the second quarter of 2018, the total number of mortgaged homes in negative equity decreased 9 percent to 2.2 million homes or 4.3 percent of all mortgaged properties. Year-over-year, the number of mortgaged properties in negative equity fell 20.1 percent from 2.8 million homes – or 5.4 percent of all mortgaged properties – in the second quarter of 2018.

"Homeowner properties continued to increase in value this quarter with homeowners gaining an average of $16,200 in home equity wealth," said Dr. Frank Nothaft, chief economist for CoreLogic. "When aggregated across all homeowners that totals almost $1 trillion in gains in home equity wealth. This wealth gain will support additional consumption spending and home improvement expenditures in coming years."

Negative equity, often referred to as being underwater or upside down, applies to borrowers who owe more on their mortgages than their homes are worth. Negative equity can occur because of a decline in a home's value, an increase in mortgage debt or both. Negative equity peaked at 26 percent of mortgaged residential properties in the fourth quarter of 2009, based on the CoreLogic equity data analysis which began in the third quarter of 2009.

The national aggregate value of negative equity was approximately $279.8 billion at the end of the second quarter of 2018. This is down quarter over quarter by approximately $5.5 million, from $285.3 billion in the first quarter of 2018.

"Negative equity levels continue to drop across the US with the biggest declines in areas with strong price appreciation," said Frank Martell, president and CEO of CoreLogic. "Further, the relatively low level of shadow inventory contributes to the chronic shortage of housing supply and price increases in many markets."

However, among those metro areas experiencing negative equity, Miami, Fla. may be hurting the most, with the negative equity share of all mortgages standing at 11.4 percent year over year.

The Homeowner Equity Insights report is published quarterly with coverage at the national, state and Core Based Statistical Area/Metro level and includes negative equity share and average equity gains, according to CoreLogic.

© 2018 Florida Realtors®

Positive Trends Continue in August 2018

Fla. housing market: Positive trends continue in Aug. 2018

ORLANDO, Fla. – Sept. 20, 2018 – Florida's housing market reported more sales, more new listings and higher median prices in August compared to a year ago, according to the latest housing data released by Florida Realtors®. Sales of single-family homes statewide totaled 26,273 last month, up 4.2 percent compared to August 2017.

"August marked the second month in row that Florida's housing market experienced a rise in new listings, which is a good sign for potential homebuyers," says 2018 Florida Realtors President Christine Hansen, broker-owner with Century 21 Hansen Realty in Fort Lauderdale. "New listings for existing single-family homes rose 6.6 percent compared to a year ago and new listings for condo-townhouse properties increased 4.1 percent from last August.

"At the same time, the median time for a sale to go to contract is getting shorter: For single-family homes, it was 36 days, down 2.7 percent; for condo-townhouse properties, it was 46 days, down 6.1 percent. With such a quick turnaround time to contract, a Realtor with local expertise can help buyers and sellers navigate the market."

August marked the 80th consecutive month (over six and a half years) that the statewide median sales prices for both single-family homes and condo-townhouse properties rose year-over-year. The statewide median sales price for single-family existing homes was $254,290, up 6.0 percent from the previous year, according to data from Florida Realtors Research Department in partnership with local Realtor boards/associations. Thestatewide median price for condo-townhouse units in August was $185,000, up 8.8 percent over the year-ago figure. The median is the midpoint; half the homes sold for more, half for less.

According to the National Association of Realtors (NAR), the national median sales price for existing single-family homes in July 2018 was

Looking at Florida's condo-townhouse market, statewide closed sales totaled 10,365 last month, up 6.6 percent compared to a year ago. Closed sales data continued to reflect fewer short sales and foreclosures in August: Short sales for condo-townhouse properties dropped 18.8 percent and foreclosures fell 28.9 percent year-to-year; while short sales for single-family homes declined 34.2 percent and foreclosures fell 30.1 percent year-to-year. Closed sales may occur from 30- to 90-plus days after sales contracts are written.

"The dominant story across Florida's housing markets over the past couple of years has been the shortage of single-family homes for sale, but in the July numbers, instead of the usual year-over-year decline, we saw that inventory was virtually unchanged from the level we reported for July of 2017," says Florida Realtors Chief Economist Dr. Brad O'Connor. "So the question is, is this the beginning of a trend? According to the newly released August data from Florida Realtors, it very well could be.

"As of August 31, we found that the statewide inventory of single-family homes was up 4.5 percent compared to the same point in time last year, marking the first tangible year-over-year increase we've seen in end-of-month inventory in over three-and-a-half years.Should single-family inventory levels continue to rise, especially in the price tiers where demand is the greatest, we can probably expect some acceleration in sales growth and more modest rates of price growth."

According to Freddie Mac, the interest rate for a 30-year fixed-rate mortgage averaged 4.55 percent in August 2018, up from the 3.88 percent averaged during the same month a year earlier.

To see the full statewide housing activity reports, go to Florida Realtors Research & Statistics section on floridarealtors.org. Realtors also have access to local market stats (password protected) on Florida Realtors' website.

© 2018 Florida Realtors®

Realtor.com: Luxury Market Picks up Speed

Realtor.com: Luxury market picks up speed

SANTA CLARA, Calif. – Sept. 19, 2018 – Luxury home sales continued to break records as prices hit double-digit gains in 20 major counties, according to the realtor.com 2018 Luxury Home Index released today. Additionally, the number of sales at or above the $1 million mark rose 6 percent over last year.

The realtor.com Luxury Home Index analyzes the luxury price tier, defined as the top 5 percent of all residential sales, in 90 U.S. counties.

Demand for luxury homes remains strong
The pace of sales for luxury homes remains strong. The combined median age of inventory in the 90 luxury markets surveyed was 121 days, down nine days or 6.9 percent year-over-year. Additionally, two-thirds of luxury markets are seeing inventory move faster than this time last year.

In 50 of the 90 counties analyzed, the luxury tier currently has an entry point of at least $1 million, while 70 markets continue to see yearly price growth.

"The conditions in the luxury segment are quite different from the market overall – it's really a tale of two markets," says Danielle Hale, chief economist for realtor.com. "Although U.S. median listing prices show signs of slowing growth, luxury prices are moving in the opposite direction in many places. For the second consecutive month, we've seen more markets with double-digit, entry-level luxury price growth than in the past four years."

Sarasota stays on top
Since March, Sarasota, Fla. has remained the nation's fastest-growing luxury market, with sales prices up 21 percent since last June. Half of all luxury homes in Sarasota sold within 165 days – 22 percent faster than the previous year. Queens, N.Y.; Santa Clara, Calif.; Boulder, Colo.; and Naples (CollierCounty, Fla.)rounded out the top five counties, each seeing yearly price growth between 13 and 15 percent.

Miami's luxury market starts heating up
Recent trends in Miami's luxury segment suggest that the luxury entry point could break the $1 million mark for the first time this fall. After declining for 24 months in a row, Miami luxury prices finally saw growth this January and have now reached the highest price gains since July 2015. Miami's luxury market is currently growing at 2.2 percent year-over-year.

Other surrounding South Florida counties, including Broward, Collier, Lee, and Palm Beach, saw similar declines in recent years, but many of them have outpaced the rest of the country since early last year with yearly price growth between 5 and 13 percent.

Other U.S. marketsNorthern California luxury markets continue performing well, with seven counties in the top 20 fastest growing markets, all of which saw double-digit growth in June. San Francisco, Sonoma, and Santa Clara – up 10, 13, and 15 percent, respectively – are showing there is still room for growth. On the other hand, San Mateo, Sacramento, San Luis Obispo, and Santa Cruz are holding steady.

There's a hot streak in Davidson and Williamson counties, both part of the greater Nashville area, which grew 12 and 11 percent, respectively. Both saw double-digit growth in June, after steadily gaining momentum since 2016. Half of all luxury homes sold in 61 days in Davidson County, putting it among the nation's 10 fastest-moving luxury markets.

Seattle (King County, Wash.) luxury grew by 13 percent in June compared to the same time last year, pushing its luxury entry point to $1.5 million. This marks Seattle's 11th consecutive month of growth between 12 and 14 percent. As the market's growing tech scene funnels in a more affluent crowd, more buyers can afford pricier homes, which may push demand - and prices - higher.

© 2018 Florida Realtors®

Top Reasons for Risky RE Behavior? Fear of Losing a Deal


Top reason for risky RE behavior? Fear of losing a deal

CHICAGO – Sept. 17, 2018 – What would you be willing to do in order to keep a real estate transaction from falling through? Would you literally put your life on the line to save a deal? Ask any agent or broker, and the answer likely will be an easy "no."

But according to real estate safety instructor Cheryl Knowlton, president of Elite Edge Real Estate Training, practitioners most commonly cite fear of losing the deal as the reason they don't follow safety protocols on the job. However, a third of the nation's 1.3 million Realtors® say that they've faced professional situations that made them afraid for their personal safety or the security of their personal information, according to the National Association of Realtors' (NAR) 2018 Member Safety Report.

Though fewer Realtors say they've been in harm's way on the job – 33 percent, down from 38 percent in 2017 – there's still a prevailing motivation in the industry to put business interests above all else, says Knowlton, who recently hosted a safety webinar called "Habits to Keep You Safe on the Job Year-Round."

"We don't want you to lose a deal, but we also don't want you to lose your life," Knowlton said during the webinar.

Sixteen real estate professionals were killed in homicides while on the job last year, and 64 suffered fatal injuries, according to figures from the U.S. Bureau of Labor Statistics cited in NAR's "Real Estate Safety Matters" course. Bad habits that make you more vulnerable to safety threats in real estate – such as working alone, focusing on something other than your immediate surroundings, and meeting prospects in the field before verifying their identity – take time to break, Knowlton said. She offered a five-step process for changing unsafe work habits.

  • Admit that you need to make a change. "Whether you're creating a new, good habit or breaking a bad one, you can't change anything you're not willing to acknowledge," Knowlton said.

  • Understand the things that can trigger bad habits. Knowlton said two things often lead real estate professionals to skirt safety protocols: the need to save time and a "faulty belief that I'm going to lose this deal, and it's going to go to my competition if I don't do these things – meet strangers in strange places and keep doing things the way I've always done them."

  • Change your routine one action at a time. If you typically meet prospects for the first time at property showings, start committing to having a phone conversation with them first, where you can gather information about the potential client and their needs. Identify behaviors that are problematic for your safety, and institute one action that could help alleviate the danger. Eventually, it will become a new habit.

  • Believe that it's necessary to change behaviors. You won't be able to change your behavior long term unless you believe it truly makes a difference in your life, Knowlton said. "We've got to believe that we can and will make the changes necessary" and "tap into the reasons why we want to make those changes."

  • Reward yourself for making small but significant changes. "You can eat an elephant if you take it one bite at a time," Knowlton said. "I used to be guilty of setting gigantic goals, and then becoming frustrated and overwhelmed because I didn't achieve what I set out to do in the timeframe I set out to do it." Without recognizing the small shifts you make in pursuit of a larger change in your routine, the effects won't be long-lasting.

Source: National Association of Realtors® (NAR)

© 2018 Florida Realtors®

Fla. Consumer Confidence Drops a Bit but Still High for Year

GAINESVILLE, Fla. – Sept. 4, 2018 – Consumer sentiment fell 2.3 points in August to 98.3 but with a revised figure of 100.6 in July, the Florida consumer sentiment index topped 100 points for the third time this year – an event not seen since 2000.

Among the five components that make up the index, one increased and four decreased this month.

Current attitudes
Floridians' perceptions of their personal financial situations now compared with a year ago showed the biggest decline in this month's reading from 94.1 to 88.2, decreasing 5.9 points.

On the other hand, opinions as to whether this is a good time to buy a major household item like an appliance increased 4 points from 105.4 to 109.4.

"While these two components moved in opposite directions, they showed overall that opinions regarding current economic conditions have decreased slightly among Floridians in August," says Hector H. Sandoval, director of the Economic Analysis Program at UF's Bureau of Economic and Business Research.

Future conditions
Opinions regarding future economic conditions also decreased this month. Respondents' expectations of their personal financial situations a year from now showed the second biggest drop from 106.9 to 101.7, decreasing 5.2 points.

Expectations of U.S. economic conditions over the next year fell 1.7 points, from 98.2 to 96.5 and anticipation of U.S. economic conditions over the next five years dropped 2.7 points from 98.2 to 95.5.

"Floridians are more pessimistic in August," Sandoval says. "While most of the pessimism comes from the overall expectations regarding the future economic conditions, Floridians also expressed unfavorable perceptions of their personal financial situation now compared with a year ago."

Florida's economy continued expanding with more jobs added this month, tightening the labor market even further. Comparing July 2018 with the same month last year, 210,600 jobs were added statewide, an increase of 2.5 percent.

Among all industries, leisure and hospitality gained the most jobs, followed by construction, education and health services, and professional and business services. Furthermore, unemployment levels in Florida are currently at their lowest since the last recession. According to the latest report, the unemployment rate decreased one-tenth of a percentage point from 3.8 in June to 3.7 in July.

Similarly, overall economic conditions in the U.S. continued to be positive, with a labor market that continued to strengthen, economic activity that has continued rising at a strong rate, and an annual inflation rate close to 2 percent. In view of this economic outlook, the Federal Open Market Committee decided in August to maintain the range of the federal funds interest rate between 1.75 and 2 percent to support further strengthening in the labor market.

"Despite the decline in consumer confidence experienced in August, overall confidence has remained high among Floridians in the last months," Sandoval says. "Given the positive economic outlook, an increase in wages is typically expected to follow after the tightening of the labor market, resulting in greater consumption and economic activity."

Conducted August 1-28, the UF study reflects the responses of 393 individuals who were reached on cellphones, representing a demographic cross section of Florida. The index used by UF researchers is benchmarked to 1966, which means a value of 100 represents the same level of confidence for that year. The lowest index possible is a 2, the highest is 150.

© 2018 Florida Realtors®

IMG_0399.JPG

Jan. builder confidence down a bit from record level

Jan. builder confidence down a bit from record level


WASHINGTON, Jan. 17 – Builder confidence in the market for newly-built single-family homes dropped two points to 72 in January on the National Association of Home Builders/Wells Fargo Housing Market Index (HMI). At the end of 2017, it hit an 18-year high of 74.

"Builders are confident that changes to the tax code will promote the small business sector and boost broader economic growth," says NAHB Chairman Randy Noel. "Our members are excited about the year ahead, even as they continue to face building material price increases and shortages of labor and lots."

"The HMI gauge of future sales expectations has remained in the 70s, a sign that housing demand should continue to grow in 2018," says NAHB Chief Economist Robert Dietz. "As the overall economy strengthens, owner-occupied household formation increases and the supply of existing home inventory tightens, we can expect the single-family housing market to make further gains this year."

The three HMI components registered relatively minor losses in January. The index gauging current sales conditions dropped one point to 79, the component charting sales expectations in the next six months fell a single point to 78, and the index measuring buyer traffic fell four points to 54.

Looking at the three-month moving averages for regional HMI scores, the West rose two points to 81, the South increased one point to 73, the Midwest inched up a single point to 70 and Northeast climbed five points to 59.

Derived from a monthly survey that NAHB has been conducting for 30 years, the Index gauges builder perceptions of current single-family home sales and sales expectations for the next six months as "good," "fair" or "poor." The survey also asks builders to rate traffic of prospective buyers as "high to very high," "average" or "low to very low." Scores for each component are then used to calculate a seasonally adjusted index where any number over 50 indicates that more builders view conditions as good than poor.

© 2018 Florida Realtors®

Source: floridarealtors.org

NAHB panel: Housing will continue to gain ground in 2018

NAHB panel: Housing will continue to gain ground in 2018


ORLANDO, Fla. – Jan. 10, 2018 – The newly enacted tax law will create a more favorable tax climate for the business community, which should spur job and economic growth and keep single-family housing production on a gradual upward trajectory in 2018, according to economists speaking at the National Association of Home Builders (NAHB) International Builders' Show in Orlando, Fla., on Tuesday.

"We expect that tax reform will boost GDP growth to 2.6 percent in 2018, and this added economic activity will also bode well for housing, although there will be some transition effects in high-tax jurisdictions," said NAHB Chief Economist Robert Dietz. "Ongoing job creation, expected wage increases and tight existing home inventory will also boost the housing market in the year ahead."

However, builders will continue to deal with ongoing supply-side headwinds this year that will dampen more robust growth.

Those headwinds include an increasing number of unfilled construction jobs, a shortage of buildable lots and a slow growth in acquisition, development and construction loan activity that is failing to keep pace with rising demand.

In addition, regulatory costs stemming from building codes, land use, environmental and other rules have jumped 29 percent in the past five years, with a significant impact on housing affordability. The ongoing U.S.-Canada softwood lumber trade dispute is further exacerbating the situation, as the price of softwood lumber has increased 20 percent from a year ago.

The forecast

  • As the economy continues to strengthen, NAHB expects 30-year fixed-rate mortgages will average 4.31 percent in 2018 and 4.82 percent in 2019.
  • NAHB projects 1.21 million total housing starts in 2017 and expects overall production to grow an additional 2.7 percent this year to 1.25 million units.
  • Single-family starts are expected to rise 5 percent in 2018 to 893,000 units and increase an additional 5 percent to 940,000 next year.
  • Setting the 2000-2003 period as a benchmark for normal single-family housing activity when single-family production averaged 1.3 million units annually, single-family starts are expected to gradually rise from 63 percent of what is considered a typical market in the third quarter of 2017 to 73 percent of normal by the fourth quarter of 2019.

On the multifamily side, NAHB expects multifamily starts to edge 1.6 percent lower this year to 354,000 units from a projected 360,000 in 2017 – a "sustainable level due to demographics and the balance between supply and demand."

Meanwhile home remodeling is posting strong market conditions, due in part to strong demand in the wake of the terrible hurricane and wildfire season in 2017. Residential remodeling activity is expected to register a 7 percent gain in 2018 over last year.

Healthy housing markets

Delving beneath the national numbers, David Berson, senior vice president and chief economist at Nationwide Insurance, said the vast majority of local housing markets are healthy and faring well.

Berson lists 324 markets as positive, 69 as neutral and just seven as negative. While job gains, household formations and mortgage markets still look good, he noted that rapid price increases are concerning.

Comparing current conditions with the housing boom a decade ago, Berson noted that the market is supply constrained today but wasn't during the boom. And mortgage credit, while more readily available than just a few years ago, remains far limited relative to the market peak in 2007. While he anticipates a slightly more rapid rise in mortgage interest rates this year, Berson said it should not hurt housing activity.

"Mortgage rates are expected to rise from 4 percent to 4.5 percent by the end of year," he said. "However, housing demand remains strong and wages are solid, and this will more than offset the negative effects from rising rates."

Home prices up, affordability down

CoreLogic Chief Economist Frank Nothaft also expects mortgage interest rates and home prices to post moderate increases in 2018, which in turn will lessen housing affordability. Like Berson, Nothaft expects that the benchmark 30-year fixed-rate mortgage will average 4.5 percent by the end of the year.

"Higher rates are not just a gradual erosion of affordability but also impact owner mobility," said Nothaft. "That has implications on the overall inventory for sale. Supply has been tight and for-sale inventory will continue to remain tight."

The ongoing tight inventory in the housing market will cause home and rent price growth to outpace inflation, he added, with nationwide home prices rising an average 5 percent and rental prices posting a 3 percent increase.

The biggest growth for new home sales are occurring in the South and West, where many of these metro areas have good job growth, good affordability and good weather. Nothaft listed Houston, Dallas, San Antonio, Austin, Phoenix, Atlanta and Charlotte as the top seven major markets in terms of new home sales.

Meanwhile, he reported that overall mortgage delinquency and foreclosure rates are at their lowest levels in more than a decade, but that is a different story for markets pummeled by last year's devastating hurricanes.

"Houston's delinquencies almost doubled year-over-year and that is due almost entirely to Hurricane Harvey," said Nothaft.

© 2018 Florida Realtors®

Source: floridarealtors.org

Florida Chamber: State economy will hit $1 trillion in 2018

Florida Chamber: State economy will hit $1 trillion in 2018


TALLAHASSEE, Fla. (January 9, 2017) – The Florida Chamber Foundation, Florida's non-partisan, business-led, nonprofit research organization, announced today that it expects Florida to become a $1 trillion economy by the end of 2018 and will create 180,000 jobs across Florida in 2018 – once again outpacing the U.S. economy in job growth.

"If Florida was a stock, it would be considered a strong buy. But, while Florida's economic outlook for 2018 is positive, it's not without risks, some of which can be mitigated and some of which are larger than Florida," says Mark Wilson, president and CEO of the Florida Chamber of Commerce.

An outline of key findings announced at the Florida Chamber Foundation's 2018 Economic Outlook Summit:

1. Florida will continue to lead the nation in job creation. Since the recession, Florida has created an average of 1 in every 10 jobs in the U.S. Florida Chamber Foundation predictions estimate Florida will create 180,000 jobs in 2018. For the eighth year in a row, Florida's job creation is expected to outpace the U.S.

2. Very low probability of a recession. Currently, the Florida Leading Indicators Index projects strong growth is expected and there is a 91percent likelihood Florida will NOT enter into recession over the next nine months.

3. Florida is projected to become a $1 trillion economy in 2018. It's already larger than Saudi Arabia and preparing to overtake Mexico's spot in the global economy in the coming years.

4. Business confidence is high. Initial findings released at the Florida Chamber Foundation's 2018 Economic Outlook Summit from a statewide survey of Florida "C Suite" executives conducted for the Florida 2030 report show "very high" business confidence and a likelihood of continued investments over the coming months. (Full survey results will be released in March 2018.)

5. Population growth will continue to drive Florida's economy. Florida currently ranks as the 3rd most populous state in the nation and has been growing at a rate of more than 800 residents per day over the past year. This level of growth, at a minimum, is expected to continue through 2018. The influx of Puerto Rican evacuees that will choose to stay in Florida and the recently passed federal tax bill that favors low-tax states like Florida could mean an increase in skilled professionals and families moving from high tax states like New York and California.

6. Florida could do more. Florida's growth, while expected to remain positive, continues to have two potential constraining variables: a potential shortage of skilled labor, especially in construction, and an attainable housing shortfall.

7. Long term risks exist. While Florida's economy remains strong, long-term risks include global risk and uncertainty, losing consistent leadership at the state level and a rise in the cost of living and doing business, due to overregulation and Florida's bottom-ranked legal climate.

© 2018 Florida Realtors®

Source: floridarealtors.org

HUD Announces New FHA Loan Limits for 2018

HUD announces new FHA loan limits for 2018

WASHINGTON – Dec. 11, 2017 – The Federal Housing Administration (FHA) announced the agency's new schedule of loan limits for 2018, which will increase in most areas of the country with 3,000 counties affected. The new loan limits go into effect on Jan. 1, 2018.

Under the National Housing Act (amended by the Housing and Economic Recovery Act of 2008 or HERA), FHA must set single-family forward loan limits at 115 percent of median house prices, subject to a floor and a ceiling on the limits. FHA calculates the limits by Metropolitan Statistical Area (MSA) and county.

In high-cost areas of the country, FHA's loan limit ceiling will increase to $679,650 from $636,150. FHA will increase its floor to $294,515 from $275,665.

Additionally, the national mortgage limit for FHA-insured Home Equity Conversion Mortgages (HECMs), or reverse mortgages, will increase to $679,650 from $636,150. HECM limits don't vary by MSA or county; instead, the single limit applies to all mortgages regardless of location.

The maximum loan limits for FHA forward mortgages will rise in 3,011 counties; in 223 counties, FHA's loan limits won't change.

Today, FHA's minimum national loan limit, or floor, is set at 65 percent of the national conforming loan limit of $453,100. This floor applies to those areas where 115 percent of the median home price is less than the floor limit. Any areas where the loan limit exceeds this 'floor' is considered a high-cost area, and HERA requires FHA to set its maximum loan limit "ceiling" for high-cost areas at 150 percent of the national conforming limit.

To find a complete list of FHA loan limits, areas at the FHA ceiling, areas between the floor and the ceiling, as well as a list of areas with loan limit increases, visit FHA's Loan Limits Page.

© 2017 Florida Realtors

US Consumer Confidence Improved Again

U.S. consumer confidence improved again


NEW YORK – Nov. 30, 2017 – Consumer confidence, which had improved in October, increased even more in November.

The Conference Board Consumer Confidence Index now stands at 129.5 (1985=100), up from 126.2 in October. The Present Situation Index increased from 152.0 to 153.9, while the Expectations Index rose from 109.0 last month to 113.3.

"Consumer confidence increased for a fifth consecutive month and remains at a 17-year high (Nov. 2000, 132.6)," says Lynn Franco, director of economic indicators at The Conference Board. "Consumers' assessment of current conditions improved moderately, while their expectations regarding the short-term outlook improved more so, driven primarily by optimism of further improvements in the labor market."

Franco says that consumers are "entering the holiday season in very high spirits and foresee the economy expanding at a healthy pace into the early months of 2018."

Current situation
Consumers' assessment of current conditions improved moderately in November. The percentage saying business conditions are "good" increased from 34.4 percent to 34.9 percent, while those saying business conditions are "bad" declined from 13.5 percent to 12.7 percent.

Consumers' assessment of the labor market also improved. Those stating jobs are "plentiful" increased from 36.7 percent to 37.1 percent, while those claiming jobs are "hard to get" decreased slightly from 17.1 percent to 16.9 percent.

Short-term economic outlook
Consumers' optimism about the short-term outlook was also more favorable in November. The percentage of consumers expecting business conditions to improve over the next six months increased slightly from 22.1 percent to 22.4 percent, while those expecting business conditions to worsen decreased from 7.0 percent to 6.5 percent.

Consumers' outlook for the job market was also more upbeat than in October. The proportion expecting more jobs in the months ahead increased from 18.7 percent to 22.6 percent, while those anticipating fewer jobs declined from 11.6 percent to 11.0 percent.

Regarding their short-term income prospects, the percentage of consumers expecting an improvement decreased marginally from 20.3 percent to 20.1 percent, while the proportion expecting a decrease was virtually unchanged at 7.6 percent.

The monthly Consumer Confidence Survey, based on a probability-design random sample, is conducted for The Conference Board by Nielsen. The cutoff date for the preliminary results was November 14.

© 2017 Florida Realtors

NAR: U.S. Home Prices Rise 5.3% in 3Q

NAR: U.S. home prices rise 5.3% in 3Q

CHICAGO – Nov. 2, 2017 – Severely lacking inventory levels across the country pinched sales growth and kept home prices rising at a steady clip in nearly all metro areas in the third quarter, according to the latest quarterly report by the National Association of Realtors® (NAR).

The national median existing single-family home price in the third quarter was $254,000, which is up 5.3 percent from the third quarter of 2016 ($241,300). The median price during the second quarter increased 6.1 percent from the second quarter of 2016.

Single-family home prices last quarter increased in 92 percent of measured markets, with 162 out of 177 metropolitan statistical areas (MSAs) showing sales price gains compared with the third quarter of 2016. Fifteen areas (8 percent) recorded lower median prices from a year earlier.

Lawrence Yun, NAR chief economist, says the housing market's performance during the third quarter was underwhelming.

"The stock market's climb to new record highs, the continued stretch of outstanding job growth and mortgage rates under 4 percent kept homebuyer demand at a very robust level throughout the summer," says Yun. "Unfortunately, the pace of new listings was unable to replace what was quickly sold. Home shoppers had little to choose from, and many had outbid others in order to close on a home. The end result was a slowdown in sales from earlier in the year, steadfast price growth and weakening affordability conditions."

Yun says that price appreciation moderated a bit in the third quarter, but "home prices still far exceed incomes in several parts of the country – especially in the largest markets in the South and West where new home construction simply is not keeping up with job growth."

Nineteen metro areas in the third quarter (11 percent) experienced double-digit increases, down from 23 areas in the second quarter (13 percent). Overall, there were more rising markets in the third quarter compared to the second quarter, when price gains were recorded in 87 percent of metro areas.

Total existing-home sales, including single family and condos, slipped 3.1 percent to a seasonally adjusted annual rate of 5.39 million in the third quarter from 5.56 million in the second quarter, but they're still 0.2 percent higher than the 5.38 million pace during the third quarter of 2016.

At the end of the third quarter, there were 1.90 million existing homes available for sale, which was 6.4 percent below the 2.03 million homes for sale at the end of the third quarter in 2016. The average supply during the second quarter was 4.2 months – down from 4.6 months in the third quarter of last year.

Last quarter, the uptick in the national family median income ($71,775) did little to stave off continued weakness in affordability from the combination of higher mortgage rates and home prices compared to a year ago. To purchase a single-family home at the national median price, a buyer making a 5 percent downpayment would need an income of $55,142, a 10 percent down payment would require an income of $52,240, and $46,435 would be needed for a 20 percent downpayment.

"Affordability pressures are frustratingly occurring in places where jobs are plentiful and incomes are rising," says Yun. "Without a significant boost in new and existing inventory to alleviate price growth, job creation could slow in high cost areas in upcoming years if residents begin exiling to more affordable parts of the country."

The five most expensive housing markets in the third quarter were the San Jose, California metro area, where the median existing single-family price was $1,165,000; San Francisco, $900,000; Anaheim-Santa Ana, California, $790,000; urban Honolulu, $760,200; and San Diego, $607,000.

The five lowest-cost metro areas in the third quarter were Decatur, Illinois, $86,300; Youngstown-Warren-Boardman, Ohio, $88,900; Cumberland, Maryland, $96,400; Wichita Falls, Texas, $113,800; and Elmira, New York, $117,300.

Metro area condominium and cooperative prices – covering changes in 61 metro areas – showed the national median existing-condo price was $237,200 in the third quarter, up 5.4 percent from the third quarter of 2016 ($225,100). Ninety-three percent of metro areas showed gains in their median condo price from a year ago.

Regional breakdown

Total existing-home sales in the Northeast dropped 7.9 percent in the third quarter and are 0.5 percent below the third quarter of 2016. The median existing single-family home price in the Northeast was $283,800 in the third quarter, up 4.1 percent from a year ago.

In the Midwest, existing-home sales declined 3.3 percent in the third quarter and are 0.8 percent below a year ago. The median existing single-family home price in the Midwest increased 5.6 percent to $202,400 in the third quarter from the same quarter a year ago.

Existing-home sales in the South fell 4.4 percent in the third quarter but are 0.2 percent higher than the third quarter of 2016. The median existing single-family home price in the South was $226,100 in the third quarter, 5.5 percent above a year earlier.

In the West, existing-home sales increased 2.8 percent in the third quarter and are 1.9 percent above a year ago. The median existing single-family home price in the West increased 7.0 percent to $373,700 in the third quarter from the third quarter of 2016.

© 2017 Florida Realtors

Florida's Housing Market: Median Prices Up in Q 2017

Fla.’s housing market: Median prices up in Q 2017

ORLANDO, Fla. – Nov. 2, 2017 – Florida's housing market in third quarter 2017 showed the impact of Hurricane Irma, which made landfall in the Keys on Sept. 10. The latest housing data released by Florida Realtors®reported higher median prices year-over-year, but fewer closed sales, pending sales and new listings due to the disruption in September's market caused by the hurricane. Closed sales of single-family homes statewide totaled 67,811 in 3Q 2017, down 5.5 percent over the 3Q 2016 figure.

"Florida's economic and jobs outlook continued to show momentum in the third quarter, despite the devastation and disruption caused by Hurricane Irma striking our state on Sept. 10,"said 2017 Florida Realtors®President Maria Wells, broker-owner with Lifestyle Realty Group in Stuart. "State officials reported that Florida's unemployment rate in September was 3.8 percent, which is lowerthan the U.S. unemployment rate of 4.2 percent, according to the Bureau of Labor Statistics. As expected, September's housing data reflected the negative impact that the hurricane had on existing home and condominium sales– which of course also factors into the 3Q 2017 numbers.

"To better understand what is happening in their local markets, consumers should work with a Realtor who knows the area and can help them accomplish their goals, whether that goal is buying a first home or selling one they've outgrown."

The statewide median sales price for single-family existing homes in 3Q 2017 was $240,000, up 6.7 percent from the same time a year ago, according to data from Florida Realtors Research department in partnership with local Realtor boards/associations. The statewide median price for condo-townhouse properties during the quarter was $172,000, up 7.5 percent over the year-ago figure. The median is the midpoint; half the homes sold for more, half for less.

Looking at Florida's condo-townhouse market, statewide closed sales totaled 26,366 during 3Q 2017, down 3.1 percent compared to 3Q 2016. The closed sales data reflected fewer short sales and foreclosures over the three-month period: Short sales for townhouse-condo properties declined 45.5 percent and foreclosures fell 52.9 percent year-to-year; short sales for single-family homes dropped 45.1 percent and foreclosures fell 49.6 percent year-to-year. Closed sales typically occur 30 to 90 days after sales contracts are written.

"Irma clearly left its mark on the third quarter numbers by temporarily halting business activity for a number of days in September," said Florida Realtors Chief Economist Dr. Brad O'Connor. "July and August, on the other hand, were fairly typical months relative to what we've been seeing over the past couple of years: modest growth in sales, strong growth in prices and a declining inventory of homes on the lower end of the price spectrum. We'll see a return to this pattern over the next couple of months."

In 3Q 2017, the median time to a contract (the midpoint of the number of days it tookfor a property to receive a sales contract during that time) was 37 days for single-family homes and 49 daysfor condo-townhouse properties.

Inventory was at a 3.8-months' supply in the second quarter for single-family homes and at a 5.5-months' supply for condo-townhouse properties, according to Florida Realtors.

According to Freddie Mac, the interest rate for a 30-year fixed-rate mortgage averaged 3.89 percent for 3Q 2017, significantly higher than the 3.45 percent average recorded during the same quarter a year earlier.

For the full statewide housing activity reports, go to the Florida Realtors Research & Statistics section on floridarealtors.org. Realtors also have access to local market stats (password protected) on Florida Realtors' website.

© 2017 Florida Realtors®